
What Is an Air Pollution Detection Drone?

Air pollution is often invisible, but its effects are measured in hospital visits, damaged leaves, and particles settling on windowsills. Air Pollution Detection Drones carry sensors through places that fixed monitoring stations may not represent well. They can collect readings at different heights and locations, helping researchers map changing conditions near roads, factories, or wildfire smoke. They do not make pollution disappear. They make parts of the problem easier to observe.

The scale is significant. The Health Effects Institute’s State of Global Air 2024 report estimated that air pollution contributed to 8.1 million deaths worldwide in 2021. Measurement quality matters. A drone’s readings depend on its sensor, calibration, flight path, weather, and the way data are checked against ground instruments. A colorful map is not automatically reliable evidence. That distinction is easy to miss.

WHO environmental health leader Dr. Maria Neira has warned: “Air pollution is a threat to health across all countries, but it hits the poorest and most marginalized people the hardest.” Her statement underscores why accurate local monitoring matters. This introduction examines what these drones are, how their sensors work, where they can help, and what their measurements cannot prove. Small details count. A sudden gust, a warm motor, or an uncalibrated sensor can change a reading. Drone monitoring is useful, but it still needs careful methods and human judgment.
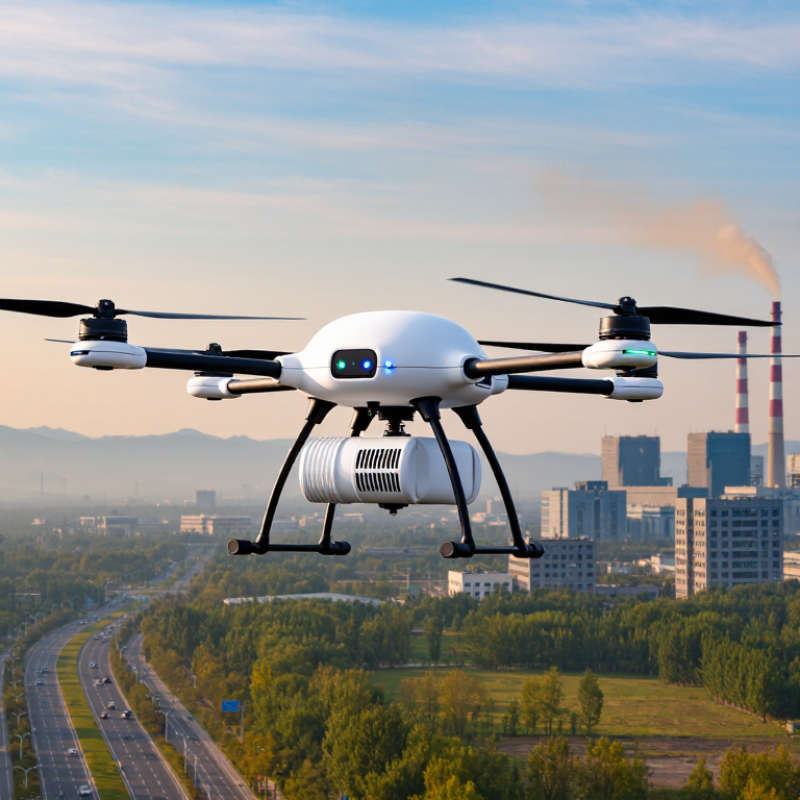
What Is an Air Pollution Detection Drone?

Definition and Core Purpose of an Air Pollution Detection Drone

An air pollution detection drone is an unmanned aircraft carrying instruments that measure pollutants in the air. Depending on its equipment, it may track fine particles, such as PM2.5, or gases such as nitrogen dioxide. Its core purpose is to collect readings across locations and heights that fixed ground monitors may not cover. A drone does not clean the air. It gathers evidence about it.

During a survey, sensors record measurements alongside the drone’s position, altitude, and time. This can help researchers compare conditions near a busy road, above a roof, or downwind from a source. Some instruments need regular calibration, and flight speed or weather can affect readings. Small details matter. A sudden gust can change what the sensor samples.

The results are useful, but they are not automatically definitive. A drone’s reading describes a particular place and moment; it cannot alone establish a long-term pollution pattern. Comparing its data with a calibrated reference monitor can improve confidence. It is also easy to mistake a colorful map for certainty. Good interpretation needs the sensor type, sampling method, and local wind conditions, and those details are sometimes incomplete.

Key Components and Onboard Sensors

An air pollution detection drone combines an unmanned aircraft with instruments that measure pollutants and record where readings were taken. Its core components include a flight controller, power system, positioning receiver, data logger, and protected sensor inlet. Onboard sensors may include optical particle counters for fine particles such as PM2.5, and electrochemical sensors for gases such as nitrogen dioxide or ozone. Temperature, humidity, and wind measurements help interpret the results. Small details matter. Rotor airflow can disturb sampling, while humidity may affect particle readings.

The World Health Organization reported that 99% of the global population breathed air exceeding its 2021 air-quality guideline levels. It also estimated 4.2 million premature deaths from ambient air pollution in 2019. These figures underline why localized measurements matter, but a drone reading is not automatically a regulatory measurement. Sensor type, calibration, inlet position, flight speed, and weather can all influence results. A useful setup records these conditions alongside each measurement and compares sensors with a trusted reference instrument.

Tips: Keep the inlet clear of rotor wash, log humidity and location, and check calibration before and after flights. Repeat routes at similar heights. Be cautious: a neat map can still hide uncertain measurements.

How the Drone Collects and Maps Air Quality Data

An air pollution detection drone carries compact sensors that sample the surrounding air as it flies. Depending on its equipment, it may measure fine particles, ozone, or selected gases. A small inlet draws air across the sensors, while GPS records each sample’s location and altitude. Readings are time-stamped, so analysts can compare a flight path with changing measurements. Conditions matter. Wind, humidity, and temperature can affect results.

To map air quality, the drone follows planned routes across streets, work sites, or other study areas. Its sensors collect readings at regular intervals, then software places those readings on a map. Researchers may compare flight data with ground monitors and weather records to spot patterns, such as a particle increase near a busy road. The map is an estimate, not a perfect picture: readings between flight paths may be interpolated, and sensor response can vary. I would treat a sharp hotspot as a clue to investigate, not a final verdict.

Tips: Check sensor calibration before each flight, and record weather and flight height. Keep the route consistent when comparing days. Short, repeated surveys help. Don’t overread one point. A drone samples only where and when it flies, so ground checks can make the map more dependable.

What Is an Air Pollution Detection Drone? - How the Drone Collects and Maps Air Quality Data

Data or Pollutant Typical Unit How the Drone Collects It How It Is Mapped Important Consideration
Fine particulate matter (PM2.5) µg/m³ An onboard optical particle sensor estimates particle concentration from light scattered by airborne particles drawn into its inlet. Time-stamped readings are paired with GPS coordinates and altitude to display concentrations along the flight path or across a gridded area. Humidity, inlet design, and airflow can affect readings; comparison with a reference monitor may be needed.
Coarse particulate matter (PM10) µg/m³ A compatible particle sensor estimates the concentration of particles in the PM10 size fraction. Measurements can be shown as route points, altitude profiles, or interpolated concentration surfaces. PM10 includes PM2.5, so the two measurements are related and should not be added together.
Nitrogen dioxide (NO₂) ppb or µg/m³ A suitable electrochemical or other gas sensor samples air through a protected inlet during flight. Georeferenced readings can highlight spatial patterns near roads or other monitored areas. Sensor response time, cross-sensitivity, and calibration influence data quality.
Ozone (O₃) ppb or µg/m³ A gas-sensing module measures ozone in air drawn through its inlet. Readings can be mapped by location and altitude to show changes across a survey area. Sunlight and atmospheric conditions affect ozone levels; the sensor must be appropriate for the intended concentration range.
Carbon monoxide (CO) ppm or mg/m³ A compatible gas sensor records CO concentration while the drone follows a planned route. Each reading is matched to its position and time to create a route-based concentration layer. Sensor range and detection limit should match the expected ambient levels.
Temperature and relative humidity °C and % RH Compact meteorological sensors measure local conditions alongside pollutant readings. These measurements can be mapped as supporting layers or used to interpret variations in pollutant data. Heat from the aircraft or electronics can influence measurements if sensors are poorly positioned.
Position, altitude, and time Latitude/longitude, m, timestamp GNSS and flight logs record where and when measurements are taken; altitude is recorded relative to the selected reference. These records locate readings on a map and allow comparison between flight paths or altitude bands. GNSS accuracy, altitude reference, and clock synchronization affect alignment of the data layers.
Mapped air-quality output Concentration by location and time Recorded sensor data are quality-checked, aligned with flight logs, and associated with their measurement units. Software can display points, flight-path charts, altitude profiles, or interpolated maps, with a legend and sampling-time information. Interpolated maps estimate conditions between measurements; they are not direct measurements at every point.

Note: Drone-based measurements depend on the sensor payload, calibration, flight conditions, and sampling plan. They complement, rather than automatically replace, ground-based reference monitoring.

Pollutants and Environmental Conditions It Can Detect

An air pollution detection drone carries sensors into places that ground monitors may miss, such as a roadside plume or a factory boundary. Its payload can measure particulate matter, including PM2.5 and PM10, and gases such as nitrogen dioxide, ozone, carbon monoxide, and sulfur dioxide. Not every drone measures every pollutant. The sensor choice matters.

The World Health Organization’s 2021 Global Air Quality Guidelines set an annual PM2.5 guideline of 5 micrograms per cubic meter and a 24-hour guideline of 15. These figures help explain why short flight readings need context: one measurement cannot establish an annual exposure level. A drone can map changing concentrations across heights and locations, but results depend on sensor calibration, flight speed, and sampling intervals. Small details matter.

Environmental conditions help interpret the readings. Temperature, humidity, wind speed, and direction can affect pollutant movement or sensor response. For example, a wind shift may move a plume away before the next pass. Humidity can also influence some particle sensors, so a high reading needs careful review. The drone’s record is useful, but not perfect; nearby traffic, buildings, and battery limits can complicate comparisons. A field log noting altitude, weather, and time makes the measurements easier to assess.

Common Uses and Operational Limitations

An air pollution detection drone carries sensors that sample air across different heights and locations. It can map pollution near roads, construction sites, industrial areas, or wildfire smoke. A flight may reveal sharp changes between a busy intersection and a nearby park. That detail matters: the World Health Organization reported in 2022 that 99% of the global population breathed air exceeding its air-quality guideline levels. Drones can help identify where closer ground monitoring may be useful. Useful, but imperfect.

The data can look precise. Its limits still deserve attention.

Operational limits shape what the measurements mean. Battery life restricts flight time, while wind, humidity, and temperature can affect sensor readings. Rotor wash may also disturb nearby air, especially during hovering or low-altitude sampling. The U.S. Environmental Protection Agency’s 2022 Enhanced Air Sensor Guidebook stresses calibration, quality checks, and environmental context for interpreting sensor data. Drone readings should therefore be treated as screening information, not automatically as regulatory measurements. Consistent routes, flight heights, and reference checks improve comparisons between surveys. Even then, a compact sensor may miss brief pollution spikes or compounds it was not designed to detect.